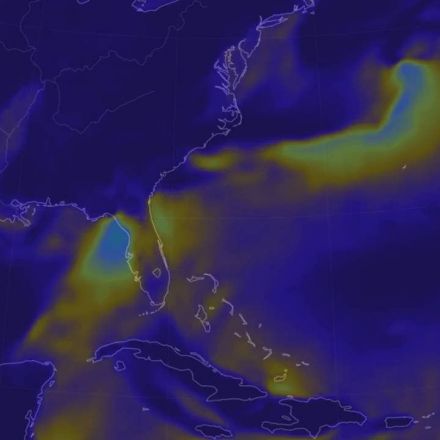
This animation models surface winds of the development of TD9 up to the current day, 2016-08-31, then seamlessly shows the +5 day potential path of the storm, up to 2016-09-01. The entire sequence is then repeated showing wind power density. Data from the GFS 2016-08-31T06:00Z run. Hurricane Gaston makes an appearance then spins out of the frame harmlessly.
Continue to article...
No comments:
Post a Comment